Published by the Ministry of Health and Welfare of South Korea · Industrial Research Institute on April 24, 2026
A Comprehensive Analysis of the Data on Foreign Patients Seeking Medical Treatment in South Korea in 2025
Statistics on foreign patients seeking medical treatment in South Korea released by the Ministry of Health and Welfare on April 24, 2025, showed that a total of 2,011,822 people came to South Korea for medical treatment throughout the year (with a total of 2.72 million visits), exceeding the 2-million mark for the first time and setting a new historical high for three consecutive years. This represents the highest record since the start of these statistics in 2009.
This report draws on official data from South Korea’s Ministry of Health and Welfare and supplements it with a microscopic analysis conducted by the BeautsGO platform. We selected de-identified data from 8% of the users (approximately 52,000 users, representing 8% of the 610,000 Chinese tourists who visit South Korea) to serve as a sample for our analysis. The analysis covered aspects such as completed transactions, locations of hospitals, and distribution of visitors.
The analysis will be presented from six dimensions: overall trends, country composition, medical specialties, healthcare institutions, regional distribution, and economic impacts.
I. Overall Trend: Three significant leaps in three years, a strong rebound after the pandemic
Since statistics began in 2009, South Korea’s market for foreign patients has gone through a complete cycle of “steady growth → sudden decline due to the pandemic → V-shaped recovery.” In 2020, the number of foreign patients plummeted to 120,000 due to the COVID-19 pandemic; by 2023, it had rebounded to 610,000, and in 2024, it exceeded 1 million, reaching 1.17 million. In 2025, the number doubled again to 2.01 million—showing “exponential” growth for three consecutive years.
Number of foreign patients and their year-on-year growth rates from 2009 to 2025
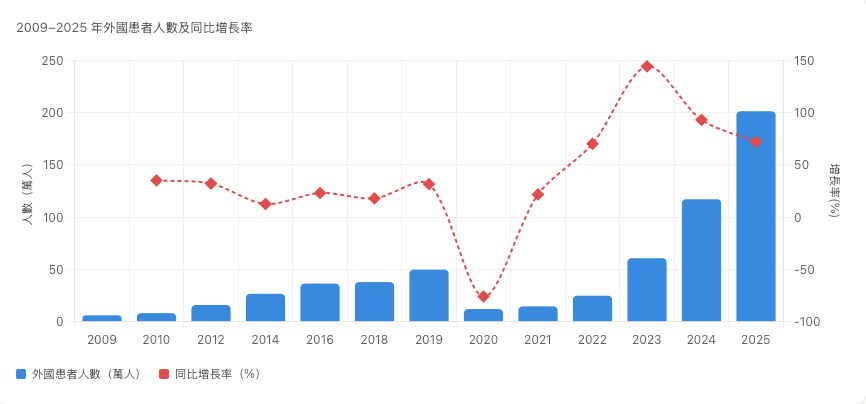
Key milestones: Starting in 2009 with just 60,000 people, the number had exceeded 5 million by 2019; due to the pandemic, it dropped sharply to 120,000 in 2020; since 2023, the number has doubled annually, and by 2025, the total number of treatments provided had reached 2.72 million, with a cumulative total of 7.06 million foreign patients having received treatment.
II. Country Composition: For the first time, China topped the list, while the pattern was dominated by three East Asian countries.
Patients from 201 different countries came to South Korea, with the top ten source countries (China, Japan, Chinese Taipei, the United States, Thailand, Singapore, Mongolia, Canada, Vietnam, Indonesia) accounting for nearly 90% of the total. The most significant change was that China surpassed Japan for the first time to become the largest source of patients, and both China and Chinese Taipei saw growth rates exceeding 120%.
Country breakdown in 2025 – Top 10 countries (%)
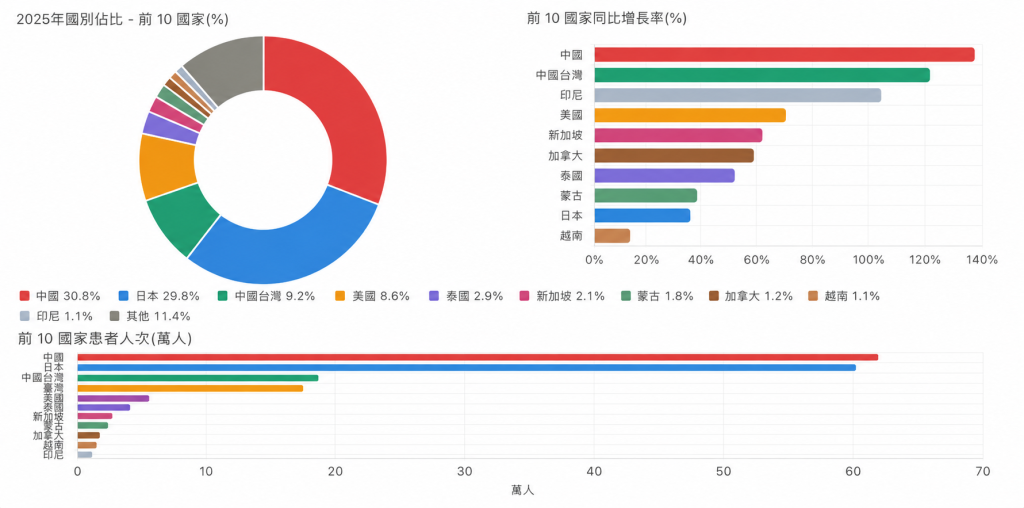
China: 30.8% Japan: 29.8% Taiwan: 9.2% United States: 8.6% Thailand: 2.9% Singapore: 2.1% Mongolia: 1.8% Canada: 1.2% Vietnam: 1.1% Indonesia: 1.1% Others: 11.4%
Key observations
The number of patients in China increased significantly, rising from approximately 260,000 to 619,000 (30.8%), representing a growth rate of 137.5%. For the first time, China surpassed Japan, which had long held the top position. Japan had 600,000 patients (29.8%), with a gap of only 19,000 patients between the two countries, indicating a very narrow difference. Taiwan, China, ranked third with 186,000 patients (9.2%), showing a growth rate of 122.5%. Together, China and Japan accounted for 60.6% of the total number of patients, and when Taiwan was included, the three East Asian regions accounted for nearly 70%, demonstrating a highly concentrated distribution.
Regional differences and characteristics
| Regional clusters | Representing the country | Key Features |
|---|---|---|
| East Asia | China, Japan, and Taiwan, China | Focusing primarily on cosmetic medical treatments, this sector has seen rapid growth. |
| North America | United States (173,000), Canada | Reaching a new high since 2009, with a focus on medical examinations and Dental services |
| Southeast Asia | Thailand, Vietnam | K-Beauty drives growth |
| Russia/Central Asia | Russia (20,000), Kazakhstan (15,000) | The growth rate was relatively slow, with a shift from internal medicine to Dermatology. |
It is worth noting that there has been a fundamental change in the structure of medical consultations in Russia: whereas internal medicine and general check-ups used to dominate, in 2025 Dermatology for the first time ranked first (with 5,641 consultations). Kazakhstan, on the other hand, maintained its traditional pattern (internal medicine with 7,741 consultations > general check-ups with 5,416 consultations > Dermatology with 1,736 consultations), and its growth rate of only 4.9% was the lowest among the top 15 countries.
III. Department of consultation: Dermatology stands out prominently, with cosmetic medical treatments accounting for 70% of the total.
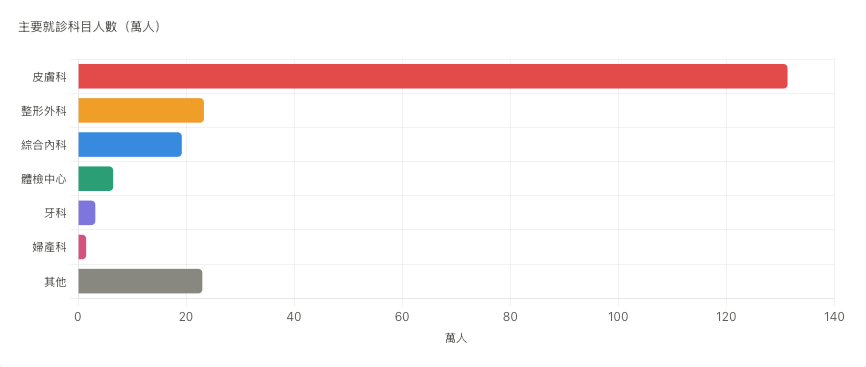
The subject structure shows a clear bias: Dermatology and plastic surgery together account for 74.1% of the total number of consultations. South Korea’s image in the field of medical tourism has shifted significantly, from being perceived as a “comprehensive medical destination” to being recognized as a “K-Beauty medical center”.
Number of patients in major treatment categories (in ten thousand)
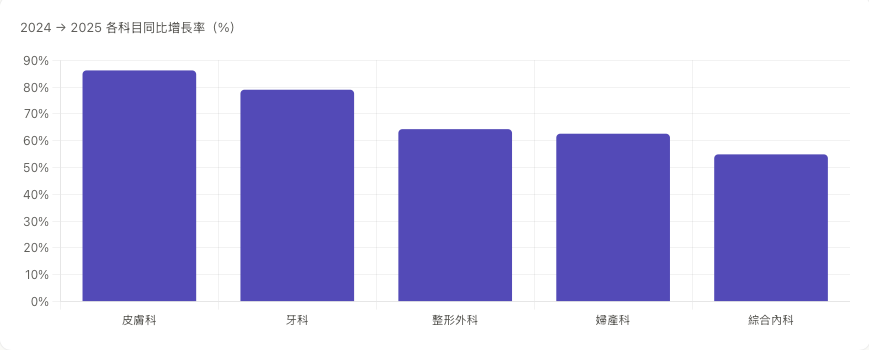
Year-on-year growth rates (%) for various categories from 2024 to 2025
Deeper meaning
Dermatology ranked first with 1.313 million patients (62.9%), which means that more than 6 out of every 10 foreign patients visiting South Korea do so for cosmetic dermatological treatments. Plastic surgery came in second with 233,000 patients (11.2%), followed by general internal medicine with 192,000 patients (9.2%).
The ranking based on growth rates is different: Dental emerged as a dark horse with a growth rate of 79.0%. In particular, the number of patients visiting dental clinics increased by a staggering 128.9% year-on-year – this indicates that Dental medical tourism is becoming an emerging growth area. This trend may be related to high-value services such as orthodontics and dental implants, which cater well to the middle-class consumer power in China and Southeast Asia.
IV. Composition of medical institutions: Clinics play a leading role, while large hospitals offer “zero-cost” services.
87.7% of patients seek treatment at primary medical institutions (such as outpatient clinics) rather than large general hospitals. This directly refutes the concern that “foreign patients will deplete the country’s medical resources.”
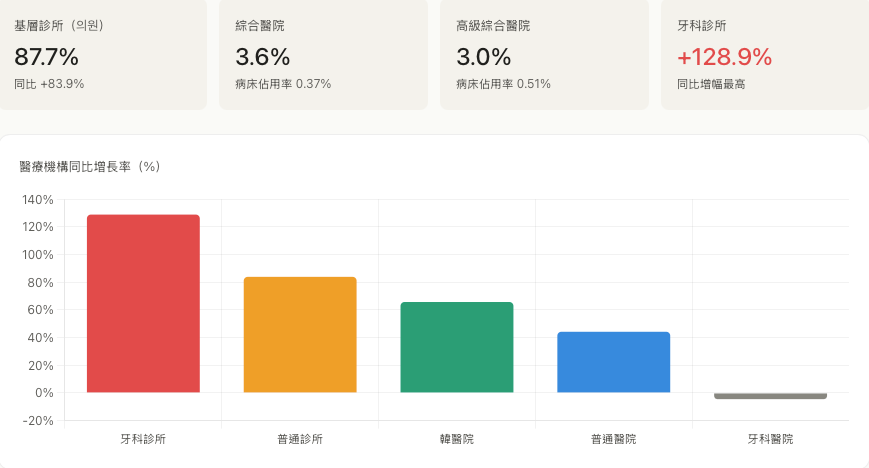
Key facts: The occupancy rates of beds for foreign patients in advanced general hospitals and general hospitals are both less than 1% (0.51% and 0.37% respectively), which is significantly lower than the statutory limits (5% and 8%). This indicates that the impact of medical tourism to South Korea on the local healthcare system is virtually negligible.
V. Regional distribution: Seoul dominates 87.2%, while Busan and Jeju have seen significant growth.
The geographical distribution is highly concentrated in Seoul: 1.76 million patients are located in Seoul, accounting for a staggering 87.2% of the total. This is directly related to the fact that 62.5% of all certified medical institutions for foreign patients (a total of 2,555) are located in Seoul.
Regional Distribution (%)
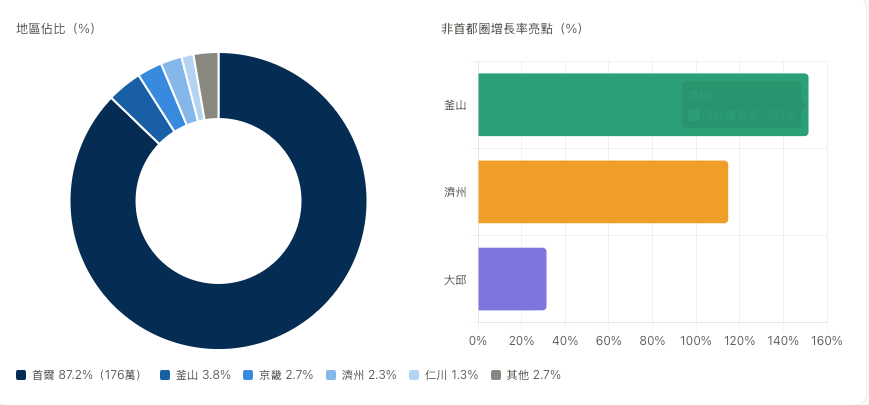
Seoul: 87.2% (1.76 million); Busan: 3.8%; Gyeonggi: 2.7%; Jeju: 2.3%; Incheon: 1.3%; Others: 2.7%.
Key points of regional analysis
Seoul’s Gangnam District is home to a large number of Dermatology and plastic surgery clinics. Coupled with the convenient transportation links between Incheon Airport and Seoul, as well as the vibrant shopping areas in Myeongdong and Gangnam, this region has formed an integrated service chain that combines “airport access, shopping, and medical aesthetics.” Busan and Jeju have emerged as the two standout areas outside the capital region, with growth rates of 151.5% and 114.7%, respectively. Busan has primarily benefited from the close proximity of its location to western Japan (Fukuoka, Osaka), attracting many visitors from these areas; Jeju, on the other hand, has leveraged its visa-free policy and resort atmosphere to attract Chinese tourists. Although their contribution is relatively small, Gyeonggi (2.7%) and Incheon (1.3%) also play a role in supporting the regional development outside the capital area.
VI. Economic Impact: Medical treatment and related expenses amount to 12.5 trillion won, generating an additional impact of 22.8 trillion won.
According to estimates by the Korea Institute of Industrial Economics, the total expenditure on medical tourism by foreign patients and their accompanying personnel amounted to 12.5 trillion Korean won (approximately 9 billion US dollars), of which 3.3 trillion Korean won were spent solely on medical treatment. Furthermore, the resulting production-induced effects totaled an astonishing 22.8 trillion Korean won (about 16 billion US dollars).
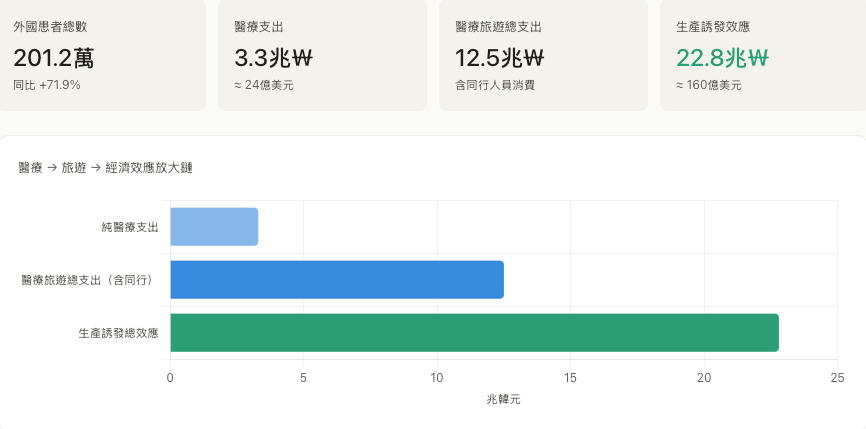
Economic structure characteristics: Medical expenditures account for only 26% of the total spending (3.3/12.5), which means that for every 1 yuan spent by foreign patients on medical treatment, they will also spend an additional 3 yuan on shopping, accommodation, dining, and other related activities. This composite consumption model of “medical treatment + tourism + shopping” is precisely the core logic behind South Korea’s government’s efforts to promote the “medical tourism” industry.
VII. Analysis of Growth Drivers
Jeong Eun-yeong, Director of the Industrial Policy Bureau at South Korea’s Ministry of Health and Welfare, attributed the explosive growth expected in 2025 to four key driving forces:
Firstly, there is the visa-free policy for Chinese group tourists. The implementation of this policy for Chinese group visitors starting at the end of 2024 directly led to a 137.5% increase in the number of Chinese patients seeking medical treatment abroad – this represents the single most significant factor contributing to this trend.
Secondly, there is the VAT refund policy for cosmetic/plastic surgery services. Starting from 2025, foreign patients who receive cosmetic or plastic surgery at designated medical institutions will be eligible to apply for a 10% VAT refund, which is effectively equivalent to a 10% discount. This offers significant appeal to Chinese and Southeast Asian customers who are particularly sensitive to prices. In 2024, a total of 1.01 million VAT refunds were issued, amounting to 95.5 billion Korean won.
Thirdly, there is the spread of K-Beauty and Korean cultural content. For the first time, South Korean cosmetics ranked first in a survey of 19 countries participating in the “Biological and Health Industry Competition” (third place in 2023); in China and Singapore, “awareness of South Korean cosmetics” ranked first, while in Taiwan and Thailand it ranked second. This has created a cognitive chain where people first recognize the quality of South Korean cosmetics and then develop trust in South Korean Dermatology.
Fourthly, after the pandemic, there will be a concentrated surge in tourism demand. The suppressed demand for medical tourism between Japan and South Korea, as well as between China and South Korea, is expected to explode in 2024-2025.
VIII. Risks and Concerns
Behind this booming data lies underlying structural vulnerabilities:
Over-reliance on a single customer base in East Asia: China, Japan, and Taiwan together account for nearly 70% of our business. If political tensions between China and South Korea increase or the visa-free policies are reversed, it will have an immediate negative impact on our overall performance.
Overemphasis on cosmetic medicine: With Dermatology and plastic surgery accounting for 74% of the industry, this focus deviates from the image of South Korea as a “medical powerhouse” in high-end medical fields such as critical care, oncology, and cardiovascular diseases, potentially weakening the country’s international competitiveness in these serious medical areas.
The polarized structure of Seoul: A concentration rate of 87.2% means that regional balanced development is virtually non-existent, making it extremely difficult for local medical institutions to share in the benefits of growth.
The growth rates in Russia and Central Asia have slowed significantly: Russia’s growth rate of 21.9% and Kazakhstan’s of 4.9% are far below the average level, indicating that the traditional patient base for critical care medicine may be shifting to other countries such as Turkey and India.
IX. BeautsGO Platform: Ranking of Completed Projects
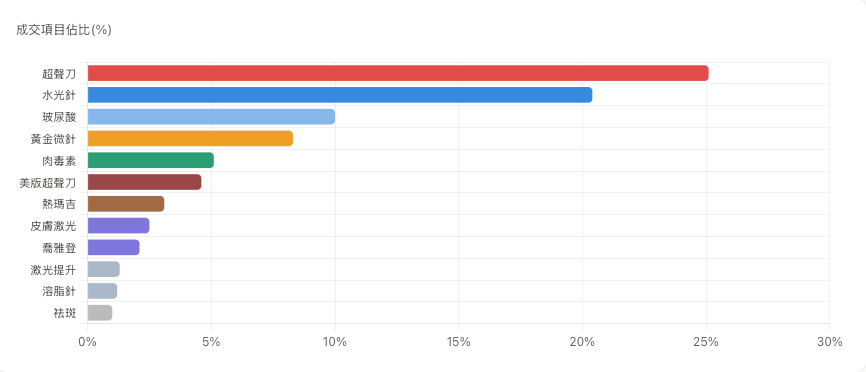
In 2025, the transactions on the BeautsGO platform mainly focused on two main categories: photothermal treatments (HIFU + Thermage + Ulthrea) and minimally invasive cosmetic procedures (Hydrofiller injections + Filler + Potenza).
Percentage of completed projects (%)
Observations based on platform data
The HIFU ranked first with a share of 25.1%, followed by Hyaluronic Acid injections with 20.4%, Filler with 10.0%, Potenza with 8.3%, and Botulinum Toxin with 5.1%. Photothermal treatments accounted for a total of 33%, while minimally invasive cosmetic procedures accounted for 38%; these two categories together accounted for 71% of all transactions. This distribution is consistent with official data, which show that Dermatology treatments account for 62.9% and Plastic Surgery treatments account for 11.2% – photothermal anti-aging treatments indeed exhibit a significant concentration of consumption among Chinese patients who seek medical beauty treatments in South Korea.
X. BeautsGO Platform: Based on the location of the hospitals in South Korea
Based on the access logs of the BeautsGO platform, the user access distribution is analyzed and categorized according to the geographical locations of the hospitals in South Korea (with precise address classification).
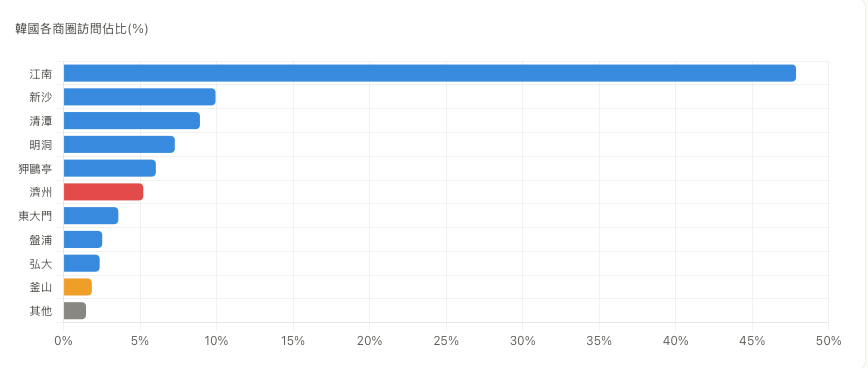
Proportion of visits to various commercial districts in South Korea (%)
Platform data observation
Among the hospitals visited by BeautsGO users, Gangnam District accounted for a staggering 47.85%, followed closely by Sinsa (9.93%), Cheongdam (8.91%), Myeongdong (7.27%), and Apgujeong (6.03%) — together, these areas represent approximately 90% of Seoul’s segmented market areas, which is highly consistent with the official figure of 87.2% for Seoul. Jeju accounted for 5.21%, significantly higher than the official rate of 2.3%, confirming the industry trend of “Jeju’s rise outside the capital region, with a growth rate of 114.7%”; in contrast, Busan’s share was only 1.85%, lower than the official figure of 3.8% — this indicates that BeautsGO’s user base is predominantly composed of users from mainland China, while Busan’s main customer group comes from western Japan.
XI. BeautsGO Platform: Ranking Based on Visitors’ Location
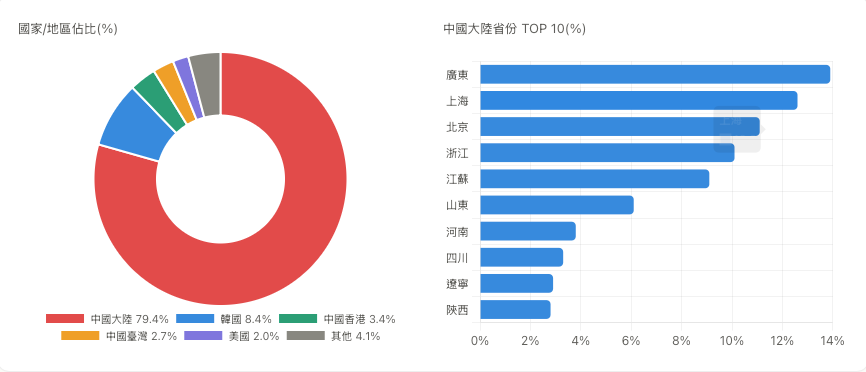
Based on the location of IP addresses, the Chinese mainland constitutes the absolute majority of BeautsGO’s users, and the internal distribution follows a typical pattern of “coastal areas taking the lead, with inland regions following closely behind.”
Observations based on platform data
Among the users of BeautsGO, 79.4% come from Mainland China, 8.4% from South Korea, and 6.5% from Hong Kong, Macao, and Taiwan. Within Mainland China, the top five provinces—Guangdong (13.9%), Shanghai (12.6%), Beijing (11.1%), Zhejiang (10.1%), and Jiangsu (9.1)—account for a combined 56.8%, reflecting a clear pattern where the coastal regions play a dominant role.
XII. BeautsGO Platform: The Top 10 Hospitals for Successful Transactions
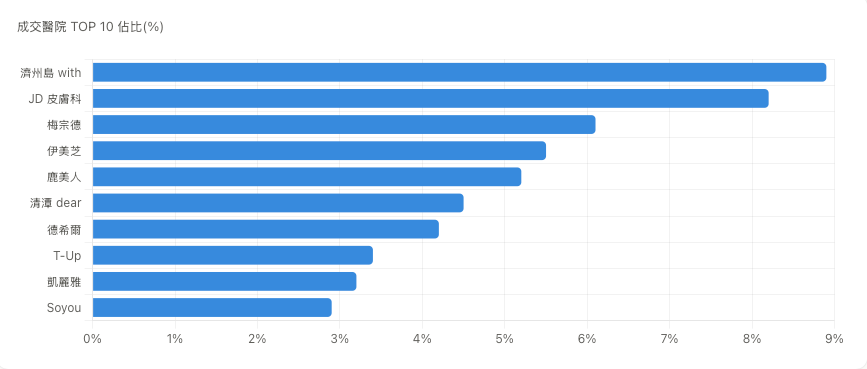
The BeautsGO platform features a high concentration of transactions, with the top 10 hospitals accounting for nearly half of all transactions.
Top 10 hospitals for transactions and their respective market shares (%)
Observations based on platform data
The top 10 hospitals contributed a total of 52.1% to the total transactions, indicating a significant concentration in this area. All 10 hospitals are Dermatology clinics or medium-sized plastic surgery centers, which is highly consistent with the official data showing that “grassroots clinics account for 87.7%” of such cases. The samples on this platform reflect the overall trend that Chinese patients seeking medical beauty treatments in South Korea tend to prefer minor cosmetic procedures and medium-sized specialized institutions.
XIII. BeautsGO Platform: Other Key Metrics
The following indicators reflect the entire decision-making process of users, from learning about BeautsGO to completing a purchase in South Korea.
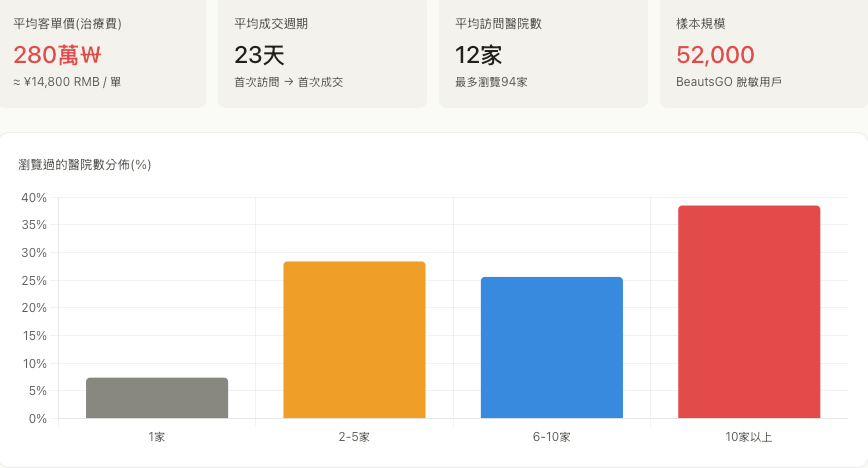
Platform data observation
Users at BeautsGO are extremely cautious when making their decisions—they typically visit an average of 12 hospitals before finalizing their choice, and 38.5% of customers who complete a transaction have viewed more than 10 hospitals. With a decision-making cycle of 23 days, it means that most users take between 3 and 4 weeks to go from initial exploration to final purchase.
In summary
According to official data from South Korea’s Ministry of Health and Welfare, the target of 2 million patients by 2025 signifies that South Korea has officially joined the ranks of Asian countries serving as medical tourism destinations. However, what the data actually reveals is that this achievement is not the result of a “comprehensive victory in medical capabilities,” but rather the combined effect of three factors: K-beauty, China’s visa-free policy for certain nationals, and VAT refunds.
According to data from the BeautsGO platform, Chinese patients seeking medical beauty treatments in South Korea exhibit a regional pattern characterized by “the coastal first-tier cities taking the lead, followed by the second-tier cities”; at the same time, the treatment options tend to concentrate around “HIFU as the main treatment + combination of minor medical beauty procedures.” At the regional level, Jeju Island shows significantly higher penetration than the industry average, confirming the trend of “the rise of non-capital areas” in this industry. Users are extremely cautious in making their decisions (on average, they visit 12 hospitals before making a choice, and the decision-making process takes 23 days), and the characteristics of “low repeat purchases + high average spending per customer” are also very evident in cross-border medical beauty services.
In the future, it will be essential for the medical tourism industry in South Korea to move from “quantitative change” to “qualitative change” – that is, while maintaining the overall scale, achieving diversification of customer sources, balance in service categories, and distribution across different regions. This will be the key factor determining whether South Korea can retain its position as the number one in medical tourism in Asia.
Data Source
Ministry of Health and Welfare of South Korea, “Performance in Attracting Foreign Patients in 2025” (released on April 24, 2026)
Analysis of the Economic Impacts of Attracting Foreign Patients in 2025 by the Korea Institute of Industrial Economics
Data on the number of users using the BeautsGO platform throughout 2025 (anonymized data from the platform, covering approximately 52,000 users)
Reference links: South Korea’s official news website (Chinese), BeautsGO official platform

-150x150.jpg)